Drink: a modern plague?
We saw in Chapter 3 how the Reverend Abraham Hume drew up a series of four maps showing the ‘Condition of Liverpool, Religious and Social’ in a self-published booklet from 1858. Hume listed a large number of public houses in the borough of Liverpool in his booklet – one for every 307 individuals, with many districts having far more than their fair share. He found a distinct geography of poverty, typically located in clusters a single turning off the main roads, yet crime was more tightly clustered still. He found criminals present in 33 of all the streets he studied, in contrast with poverty, which was present in 195 streets in total. These clusters ‘specially devoted’ to crime, vice and immorality were a focus for police concern, who reported that ‘the professional prostitute is always the ally of thieves’.37
Hume was at pains to make a distinction between crime, which might lie beyond clerical influence (though a Christian rebuke might have some effect), and immorality, which had the potential to be improved. Hume linked ‘intemperance’ with various other ‘social evils’ relating to immorality – the one being often the ‘parent’ of the other. Intemperance, meaning a lack of moderation or restraint, was a term that was in common usage by the mid-nineteenth century, so readily available to be associated with the temperance movement, namely the movement against immoderate indulgence in intoxicating drink.38
Intemperance was an important social concern during the latter half of the nineteenth century in Britain. Many organisations started to focus their efforts on social change, rather than changing the habits of individuals. James Kneale writes how the social context of drink – the role of the drink trade and rituals of conviviality (‘treating’, or buying a round of drinks amongst friends or acquaintances) – became common discussion points in temperance documents.39 Once drinking became seen as a social problem and not a disease of the individual, it was a logical move to start to map the location of the problem in its urban context, which explains the proliferation of drink maps during this period, whose cartography represented alcohol ‘as a spatial problem’.40
Charles Dickens pointed to another concern at this time: the replacement of small pubs with ‘gin palaces’. A gin palace was essentially a large building that offered gin, instead of the traditional, small pub. His chapter on the subject in ‘Sketches by Boz’ opens with a droll description of the ‘disease’ of large gin shops being created by knocking several smaller ones together, attaining a ‘fearful scale’, with quiet old pubs being replaced by plate-glassed spacious premises:
The gin-shops in and near Drury-Lane, Holborn, St. Giles’s, Covent-garden, and Clare-market, are the handsomest in London. There is more of filth and squalid misery near those great thorough-fares than in any part of this mighty city . . . The hum of many voices issues from that splendid gin-shop which forms the commencement of the two streets opposite; and the gay building with the fantastically ornamented parapet, the illuminated clock, the plate-glass windows surrounded by stucco rosettes, and its profusion of gas-lights in richly-gilt burners, is perfectly dazzling when contrasted with the darkness and dirt we have just left. The interior is even gayer than the exterior. A bar of French-polished mahogany, elegantly carved, extends the whole width of the place; and there are two side-aisles of great casks, painted green and gold, enclosed within a light brass rail . . .41
This is contrasted with the ‘filthy and miserable appearance of this part of London’ with ‘wretched houses with broken windows . . . every room let out to a different family. . .’ The gin palaces were, Dickens reported, full of ‘drunken besotted men, and wretched broken-down miserable women’. In fact, he stated that though drunkenness was a great vice, poverty was a greater vice still:
. . . and until you can cure it, or persuade a half-famished wretch not to seek relief in the temporary oblivion of his own misery, with the pittance which, divided among his family, would just furnish a morsel of bread for each, gin-shops will increase in number and splendour. If Temperance Societies could suggest an antidote against hunger and distress, or establish dispensaries for the gratuitous distribution of bottles of Lethe-water, gin-palaces would be numbered among the things that were [reduced in number and splendour]. Until then, their decrease may be despaired of.42
Temperance societies had a role to play, therefore, in mapping the ‘disease’ of gin palaces in a similar way to mapping yellow fever or cholera in a previous generation. An early example of this is the Map Shewing the Number of Public Houses in the Metropolis, which was presented in a paper about the connection between alcohol and crime read by John Taylor in 1860 ‘Before the National Association for the Promotion of Social Science’ and compiled for the National Temperance League. Along with a red mark for each location selling alcohol in London, the map included data on the population of the city at the time of the last census (1851) as well as the number of dealers in alcohol.43
A more graphically effective pub map was compiled by the National Temperance League. It featured a map of a large area of London, covered in large pink spots, one for each pub (see Figure 6.3). Entitled The Modern Plague of London, it unabashedly presented London as if it were contaminated with a ghastly disease of the skin, with a pink pox covering the central districts almost completely. The map’s dots were drawn out of scale to emphasise the problem (see Figure 6.4, a detail of the above).
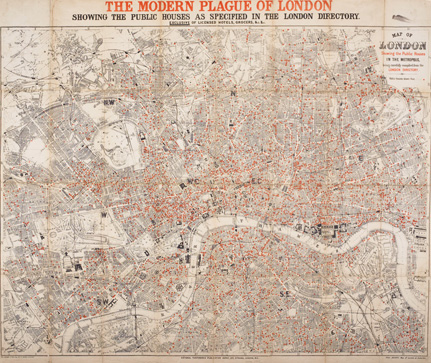
Figure 6.3
The Modern Plague of London, c.1884, showing the public houses as specified in the London Directory exclusive of licensed hotels, grocers & etc.
National Temperance League. Copyright Museum of London.
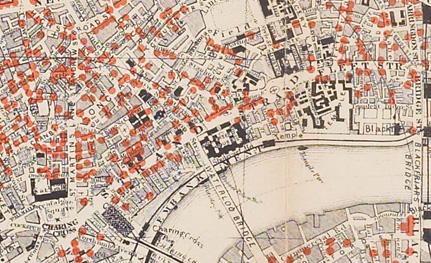
Figure 6.4
Detail of Modern Plague of London.
National Temperance League. Copyright Museum of London.
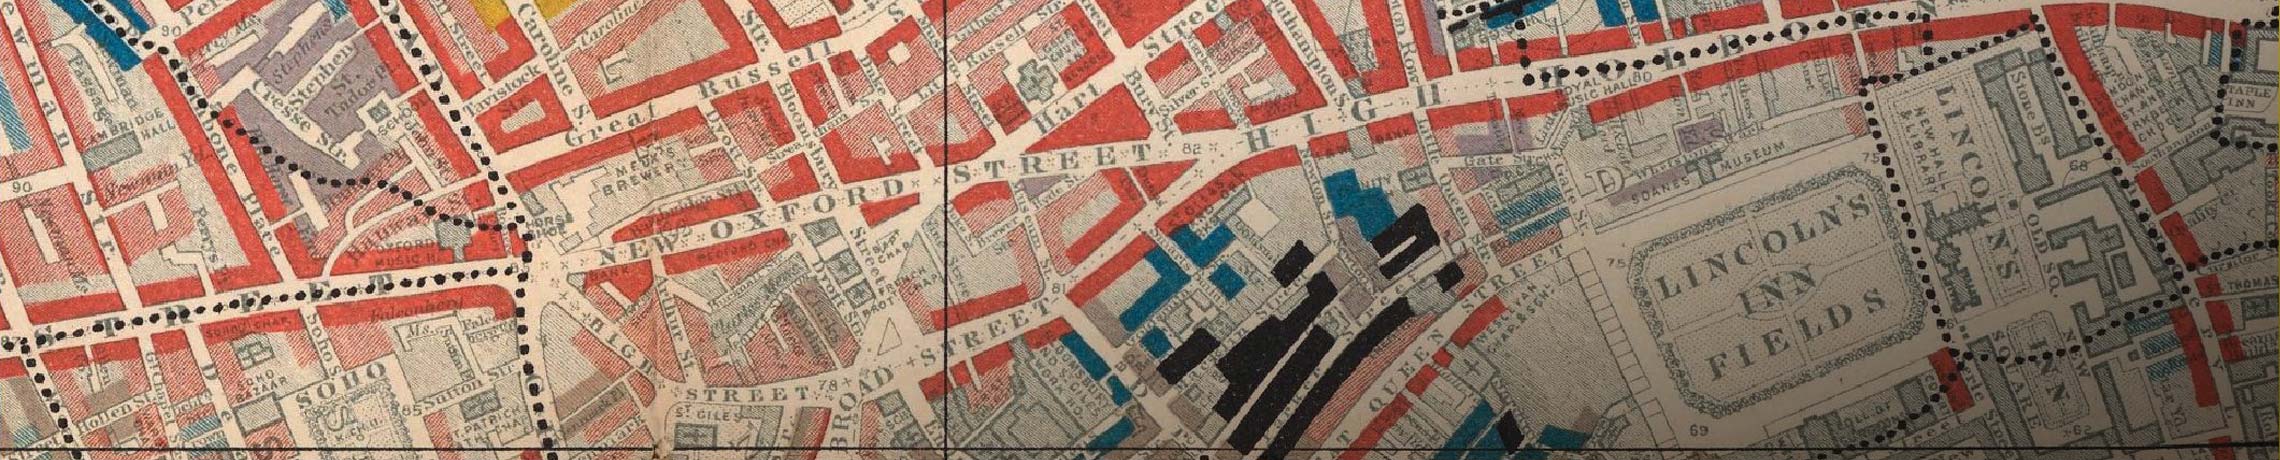
It is interesting to contrast this with Charles Booth’s own more sober drink map (see Figure 6.5), which distinguished between on- and off-licences, charting the differences between landscapes of street-corner beerhouses in working-class neighbourhoods and the grander gin palaces on the main thoroughfares of the West End of London, and showing also the relationship between intemperance and an absence of places of worship. This map, the only stand-alone map included in Booth’s vast study, was produced for the social science section of the Paris Exhibition of 1900:
On it the five different forms of licensed premises are marked according to their character, excepting that in the case of the City [which had too many to mark at this scale] . . . to give to the ordinary reader, at a glance, an impression of the ubiquitous and manifold character of the three most important social influences.44
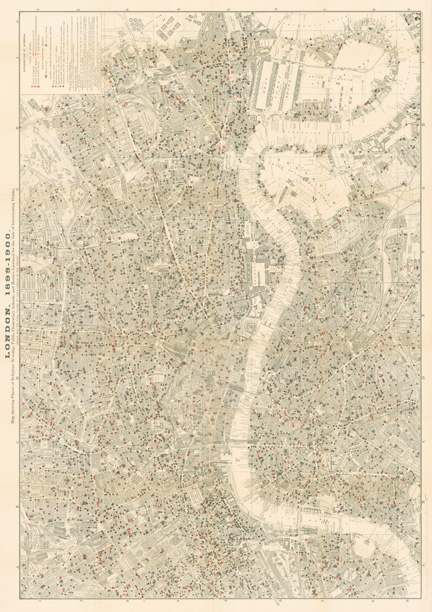
Figure 6.5
Map Showing Places of Religious Worship, Public Elementary Schools, and Houses Licensed for the Sale of Intoxicating Drinks, London, 1900.
Charles Booth, 1900. Copyright Cornell University – PJ Mode Collection of Persuasive Cartography.
Two categories of elementary school are shown, along with the six categories of places of worship (five for different church denominations and one for synagogues) and five different types of ‘Houses Licensed to Sell Intoxicating Drinks’, depending on the nature of the license (see Figure 6.6). In many places the black circles of public houses completely outnumber the churches and schools. Reading through the volume on ‘Notes on Social Influences’ for which this map is an accompaniment, the commentary repeatedly makes this association, but also brings the social influences back to the physical conditions of the built environment: ‘between evil conditions of health and evil conditions of life generally. The results of jerry building. More care exercised in paving and sweeping of streets and dust removal, but still much to be desired in poorer parts: refuse still dumped on the marshes’.45
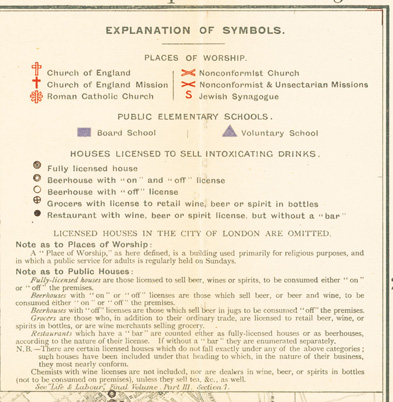
Figure 6.6
Key to Map Showing Places of Religious Worship, etc., London, 1900.
A detail from the map covers an area of the West End (see Figure 6.7) which had a veritable epidemic of pubs; it is not a coincidence that this area was chosen for another map, by Joseph Rowntree and Arthur Sherwell for their highly successful 1899 book, The Temperance Problem and Social Reform.46
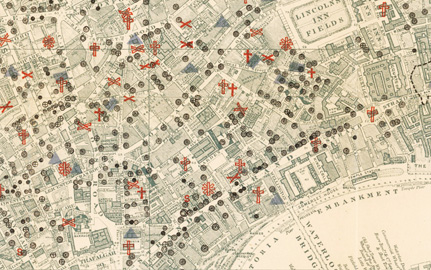
Figure 6.7
Detail of Map Showing Places of Religious Worship, etc., London, 1900.
Charles Booth, 1900. Copyright Cornell University – PJ Mode Collection of Persuasive Cartography.
Brian Harrison has written about how the pub and the temperance society were in constant competition with each other for the attention of the growing masses of Victorian urban society. This was a newdevelopment; in rural parts, there was a symbiotic relationship between pub and church, with church meetings taking place in pubs and church-goers stopping off at the pub on the way to prayers. Parsons might even promote church-ales. Moving into the city the pub became central to social life, especially for the working-class man (as we saw to a lesser extent in Rowntree’s work on York), who ‘had to choose the life of the pub and the music-hall or the life of the temperance society, mutual improvement society, and chapel: there was nowhere else to go’.47 Pubs were also stopping-off points for transportation and, prior to the building of the railways, coaching-inns took on the role of railway termini today. They would line the main commuter routes into the city, such as the Strand on Booth’s map (see road running south-west to north-east at the bottom of Figure 6.6). Indeed, remnants of the role of the pub in historical commuting routes can still be seen on the periphery of cities, such as the many pubs situated along the Great North Road leading into London through Chipping Barnet. Many of the West London pubs, just as in the East End, were catering for people working locally (see the cluster around Covent Garden market immediately north of the Strand in the Figure 6.6). Other places had areas of exclusion determined by the land owner, so the district abutting the British Museum and Russell Square on Booth’s map is markedly devoid of pubs, due to rules imposed by the area’s land owner, the Duke of Bedford; an absence of pubs enhanced the value of the estate, although the map shows pubs situated on its margins, well positioned to supply the grand houses within the area. In fact, from the 1860s onwards a clear distinction could be made between pubs licensed for drinking on their premises and ‘off-licenses’, namely establishments where you could buy drink to consume elsewhere. There were many more of the latter in prosperous areas than in poverty areas.
Harrison’s analysis shows that the dominance of pubs in poverty areas is not so much due to alcohol being a problem of poverty, but due to the importance of pubs for recreation for working-class people. Many pubs in these areas had licenses only for beer (that is, not for spirits); they provided a place of conviviality outside of the crowded home, as we saw in the analysis of the drink map of York in Chapter 4. The lit-up entrances to drinking establishments, as well as their ornate exteriors, were an attractive beacon in the dark streets of London, especially in the case of gin palaces (see Dickens quote above).
In addition to recreation, the pub served a variety of other purposes: as a meeting-place for public organisations of all types, whether reform movements or the emerging trade unions. Anne Kershen describes how in 1889 the strike committee of the Jewish branch of one of the trade unions, the AST (the Amalgamated Society of Tailors), met at ‘the unimposing White Hart public house in Greenfield Street’.48 Pubs were also used as the informal meeting point for jobbing tailors to pick up information on the availability of piecework; by the middle of the nineteenth century, rather than simply posting their names on lists of those seeking labour, the unemployed were themselves forced to wait in pubs in the hope of being selected for work by prospective employers.49 Given that pubs provided an accessible location, with an interior hidden from the public eye, it is not surprising that they also served the criminal classes, with activities such as procuring prostitutes or gambling finding their natural place there.
Revisiting the juxtaposition of churches and pubs on the map of Religious Worship . . . and Houses Licensed for the Sale of Intoxicating Drinks it becomes clearer still the extent of the battle the temperance societies had to fight against the competing attractions of drinking establishments. Putting aside Anglican churches, which were more likely to have a dominant position on the street,50 most religious institutions were in relatively tucked-away locations. More importantly, the social role of the pub, especially for the working man (and, to a lesser extent, the working woman) was as central to city life as its spatial position on the street. Nevertheless, as Harrison maintains, the pub and the temperance society were similar in their ability to provide a collective experience to the single working man, especially the many migrants from rural areas, integrating the newcomer ‘into urban society by initiating him into business habits’ and helping him to overcome the ‘shock of transition’ from the countryside to the city.51
The temperance societies in the United States had a similarly challenging role. In Chicago and other major cities the various temperance societies did battle with the large number of saloons on the city streets. Robert Graham’s 1883 pamphlet, ‘Liquordom in New York City, New York’, contained a series of maps of sections of the city’s streets, marked up with the various types of ‘liquor’ available. New York’s infamous Bowery district is shown with an almost uniform array of saloons on every street in the area, although closer inspection reveals lager beer is present on many more streets than ‘liquor’ (spirits). The pamphlet’s author Robert Graham was secretary of the Church of England Temperance Society, and had travelled to New York from England (via Canada) to organise temperance associations in the city. Having arrived in 1881 he was escorted on a tour of the city’s ‘slums’ to gather statistics on liquor licenses in order to assess the ‘state of temperance affairs in America’. His pamphlet compares the numbers of saloons, or drink-shops, and the churches and schools in New York City, writing that:
It is an undoubted fact that just where the poverty and misery is greatest, there is the largest number of saloons. Granted squalid and overcrowded homes, with a minimum of comfort and a maximum of filth, it is not to be wondered at that saloons with polished woods, meretricious gilding, light, warmth, and freedom, should compete with and beat out of the field the three bare and comfortless rooms which are home only in name. To the real home in the city of New York, which is within the reach of every man in it, there can be no deadlier enemy than the 10,168 saloons which crowd its alleys and throng its courts.52
His pamphlet states that he drew the maps to emphasise ‘the huge disproportion of saloons apparent to the eye . . . especially in the poorer quarters of the city’.53 His conclusions were not dissimilar to those regarding London, highlighting the attractiveness of public drinking places for the deeply impoverished people of New York.
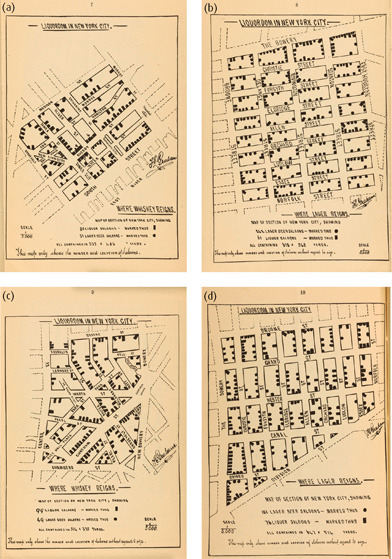
Figure 6.8
Liquordom in New York City, 1883.
Robert Graham, 1883. Copyright Cornell University – PJ Mode Collection of Persuasive Cartography.
The second edition of his pamphlet, ‘New York City and Its Masters’, published in 1887,54 highlighted the number of churches and schools (568) in comparison with the number of saloons (10,168), to show the ‘startling disproportion between agencies for good and evil’.55 The pamphlet’s maps of the 23 assembly districts of the city contain statistics on the district’s population as well as the number of churches, schools and saloons in the district, working out the ratio of saloons per head of population to argue for the need for a dramatic reduction in drinking establishments, especially in poverty areas. His work did not stop there. Graham went on to publish a pamphlet on ‘Social Statistics of a City Parish’, which investigated the social conditions, nationalities and so on of the population of Trinity Parish, New York, which was suggested as a template for further investigations into the situation in the city.
This was a period of intense activity in the social investigation of the alcohol problem.56 Almost simultaneously with Graham’s work, Henry Blair, a Republican senator from New Hampshire, was drawing up a map locating saloons across New York City to accompany his book The Temperance Movement or the Conflict between Man & Alcohol, published in 1888. His June 1886 enumeration of 10,168 saloons and places selling alcohol within the metropolis, were charted on a map of 9,000 of these57 that he termed as akin to a chart of despair:
The eye is the chief inlet to knowledge, and the map of New York city which accompanies this book, upon which are located over 9000 of the 10,168 saloons and places where intoxicating liquor was for sale in that metropolis on the thirtieth day of June 1886, looks like a chart of the capital city of the regions of despair. And when we consider that this great city controls the pivotal State of the Union, and how helplessly it drifts in the maelstrom of alcohol, we require more than the faith which removes mountains if we are still to hope for the republic.58
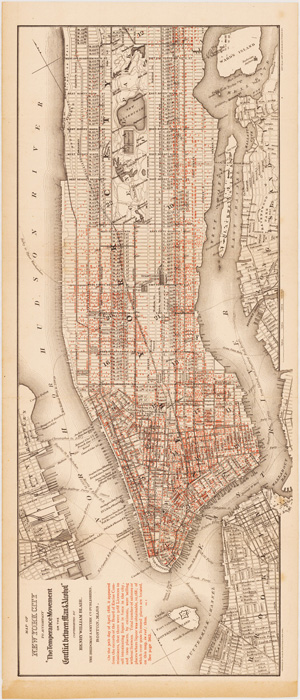
Figure 6.9
Saloon Map of New York City, 1888.
Henry Blair, 1888. Copyright Cornell University – PJ Mode Collection of Persuasive Cartography.
What is striking about Blair’s map, ‘of New York City from the Battery to Central Park, showing the Location of all Drinking-Places’, is how it shows the combination of the spatial and social dynamics which were shaping the location of saloons in New York at the time. On the one hand, the map shows a dramatic decline in the number of saloons in the more prosperous, ‘up-town’ districts of Manhattan (the right-hand end of the map); the spatial distribution of drinking places seems to confirm the prosperity–poverty trajectory proposed by all the temperance writers. Yet closer examination shows a much more intricate pattern, with some streets carrying large numbers of saloons and others, many fewer.
One of the most interesting clusters is in a dense triangle of saloons sited on the edge of the Lower East Side, at the bottom of Bowery, a street lying in the shadow of the Third Avenue elevated railway, the ‘El’ (note the markings like railway tracks in Figure 6.10). Indeed, by the late nineteenth century the Bowery had become synonymous with squalor, with Theodore Roosevelt referring to it in an essay as ‘a highway of seething life, of varied interest, of fun, of work, of sordid and terrible tragedy’.59 Its reputation as a centre of prostitution and its all-night saloons were a matter of public concern, with commentators convinced that they were the source of the ‘ruination of numberless men and boys’.60
In fact, if we zoom in on the Bowery, and its parallels such as Christie and Forsyth, it did indeed have many more saloons than elsewhere in the area. Further study shows that while there was a particularly large number of saloons around the convergence point of the three main routes in the district, the numbers reduced progressively with distance from the main routes, especially within the depths of the Lower East Side. There might be a social explanation for this: the Lower East Side was at the time the centre for Jewish immigrant settlement, and members of this community were much less likely to frequent bars than other poverty groups (see Figure 6.11). However, looking at Garyfalia Palaiologou’s space syntax analysis of Manhattan c.1891, overlaid with the enlarged section of the saloon map in Figure 6.10, we can see that while there is a social logic to the distribution, it also follows a spatial logic: Christie and Forsyth streets (running south to north on the map) are both highly accessible streets at the neighbourhood scale; in other words, you would expect there to be much more passing traffic along those streets than on the streets lying to their east. On the other hand, when considering patterns of accessibility at a more local scale, the streets at the heart of Manhattan’s Jewish quarter formed a localised area of relative inaccessibility, which would have helped create a sense of an inward-looking district that simultaneously connected outwards along its main roads.61
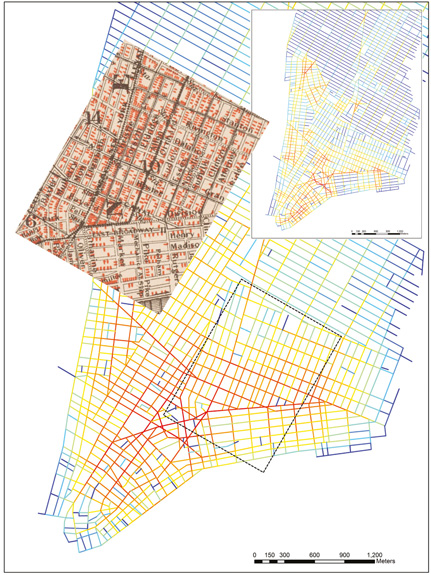
Figure 6.10
Detail of The Temperance Movement or the Conflict between Man & Alcohol (Saloon Map of New York City), 1888, overlaid on space syntax analysis of Manhattan c.1891.
The section of the saloon map is highlighted with a black, dashed box.
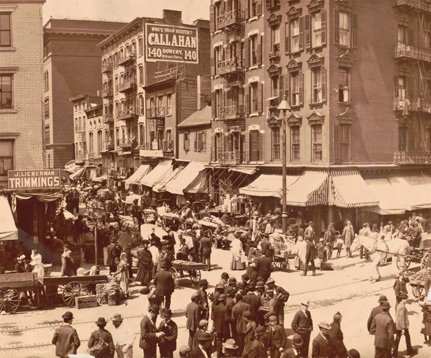
Figure 6.11
Detail fromAscene in the ghetto, Hester Street, New York, c.1902.
Photograph by Benjamin J. Falk, from Library of Congress Prints and Photographs Division Washington, D.C.
Temperance movements were much less active after the turn of the twentieth century. In the United States the passage of the 18th amendment to the constitution in 1919 brought into law the national prohibition against the manufacture of alcohol, which reinforced the anti-saloon legislation that had previously been passed in 1916 in nearly half of the states. Prohibition brought about a significant reduction in alcohol consumption and, in parallel, a rise in illegal production and consumption. The need for temperance campaign maps reduced accordingly. The same was the case in other countries such as the United Kingdom, where the devastation of the First World War shifted the public focus onto legislation to alleviate ongoing problems with housing conditions, especially for soldiers returning from war. Yet social problems continued to manifest in cities and the worst of these, criminal activity, intensified in some areas – or at least drew greater public attention due to their concentration in certain inner-city areas.