THE EMPIRICAL PROCESS OF MAPPING BLTs: TWO CONTRASTING CASES
Making outline base plans and resolving data gaps (2, 3)
The next stage for both test cases is to prepare an outline base plan, which as an end product upholds the standard of spatial equivalent information decided on for the study. Making an outline base plan actually involves two separate steps: mapping major occupiable subdivisions (2), and complementary conjecturing (3) to resolve data gaps. While two distinct processes, it is pragmatically more convenient and efficient to consider both steps when scrutinising each section of urban space. The principle of the outlines of major occupiable subdivisions composing the built environment and what they convey is explained in Chapters 4 and 5. The comparative information standard depends on the resolution and purposes of the research, and the researcher’s judgment on separating the interior and exterior domains (cf. Hillier & Hanson 1984; Chapter 6). This standard determines the level of detail on which features of the built environment are designated a proper outline. Prior knowledge of the BLT definitions, which will eventually be applied, can sometimes guide particular decisions on which lines to include or exclude as outlines. It is important that for comparative purposes the same standard can be achieved across all datasets intended for comparison. The ultimate aim is to lay a basis for equivalent spatial data with the same internal consistency and detail.
Winchester base plan
Preparing an outline base plan on the basis of MM is less straightforward than its contemporary pedigree suggests. MM as a mapping product aims to satisfy policy and legal use requirements, as well as depicting the physical layout of the built environment. MM omits entrances to buildings, while many separate single buildings are represented by several polygons. How these polygons construct a comprehensive building remains unspecified. This contrasts sharply with the way material information is conveyed by archaeological mapping. Here the OS Address Layer (version 2) will give an indication of the location and number of addresses at an approximate location, which helps the interpretation of the physical and social reality. Nonetheless, it cannot securely serve to generate the aggregates of polygons that represent each building completely. Furthermore, MM keeps a record on the development of features (extensions, adjustments, etc.), which adds further polygon confusion, preventing one from grasping empirical reality. MM also offers very basic and generalising land use classifications, and will often (but not always) indicate the provenance of a feature as either ‘natural’ or ‘man-made’. Yet, most man-made open spaces are merely described as ‘multi surface’ or ‘general surface’, which does not reveal much of the empirical reality that is actually mapped.
This demonstrates that even when working on contemporary maps, pragmatism (rules of thumb) is an absolute necessity to map a base plan. Given that MM records the contemporary situation, further information sources can be used to interpret the empirical situation represented. These sources are Google Street View, Google Maps, Bing Maps,18 and the OS Imagery Layer (vertical aerial photography). Although this can clarify much of what is represented in MM, including revealing minor discrepancies with on-the-ground reality, still various aspects of the built environment are largely inaccessible to us. This restriction mostly concerns the backs of buildings and their gardens, small alleyways, or legally and functionally censored areas. When absolute certainty is required, only a dedicated urban survey might be able to fill in the gaps left after cross-referencing various sources.
So, creating outlines based on MM involved intensive cross-referencing of various sources – photographic sources being the most intuitive – to select those lines which, firstly, convey physically existing outlines only and, secondly, are not part of internal design or composite functions within an occupiable subdivision. In exceptional instances, original MM lines received minor amendments to more precisely convey the actual physical difference on the ground and represent the topological connections accordingly. The greatest ambiguity is associated with separating buildings by internal divisions (e.g. adjoining or terraced housing) and, likewise, with complex plots, and open areas around the back. Ceteris paribus the general assumption across the whole was that in inaccessible areas all lines of MM would be physically recognisable onsite. Therefore, in principle, all features could potentially be used as outlines. Although MM itself is topologically integrally developed by the OS in GIS format, the tracing of lines is a manual process, using ArcGIS editing tools to produce original data. The result of determining outlines in MM is shown in Fig. 7.5.
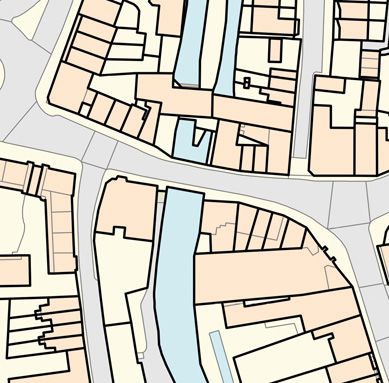
Fig. 7.5
Example of the outline base plan overlaying MM.
An example of the outline base plan (thick black lines) prepared on top of MM. The remaining grey lines (from MM) are not considered to be outlines in this methodology. (Based on OS MasterMap. © Crown Copyright 2013. All rights reserved. An Ordnance Survey (EDINA) supplied service.)
Likewise, OS1872 introduced its own interpretive difficulties and ambiguities. Some ambiguities are created by its two-year publication period, showing the city in development (see Fig. 7.2). Because the preparation of the base plan is a manual editing process, any mismatches were intuitively weighted to retain more or less continuous regular shapes (see Fig. 7.6). The image resolution and definition, as well as some detailed use of symbology, made OS1872 unsuitable for using the semi-automated raster tracing with ArcScan. Therefore, the vectorisation entailed a manual redrawing of the lines intended for the base plan.
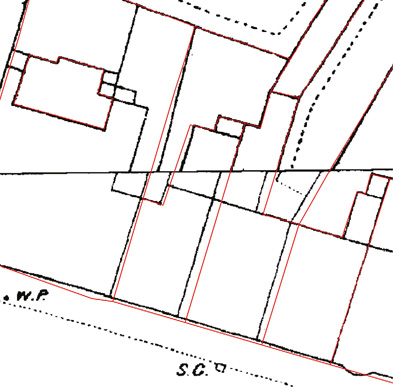
Fig. 7.6
Weighting the plan seam mismatch in vectorisation.
The mismatch along the seam between map sheets, with the weighted shapes of the outlines shown in red. (Image prepared on originals: © Crown Copyright and Landmark Information Group Limited 2013. All rights reserved. 1872.)
Digitally delivered historical OS plans do not come with a legend explaining the symbology and abbreviations used. Although Oliver (1993) mentions the existence of coloured versions of OS1872, these were not available via EDINA’s Historical Digimap services – hence, the simple black-and-white line drawing shown in Figs. 7.2 and 7.6. This often makes it ambiguous as to what kind of (physical) distinction is represented by each single solid line. Coloured plans normally convey differences between built-up areas and open areas, as well as to a degree the materials used (Oliver 1993). Nonetheless, relatively accurate reading of OS1872 can be achieved through intensive study alongside consultation of other maps of the same era at the same scale (see National Library of Scotland: Town plans n.d.), and an extensive list of abbreviations used in various OS mapping projects over the years (see National Library of Scotland: OS abbreviations n.d.).
OS1872 clearly attempts the comprehensive representation of the physically present features of the city. The general resolution for detailing was 15cm on large-scale city plans (Oliver 1993), which displays greater architectural details than MM. In addition, functional furnishings of the city were often included. Strangely, contrary to Oliver’s supposition, gates and doorways are not consistently featured on OS1872, while archways (in walls) do appear.
Vectorising towards an outline base plan thus involves selections and interpretations (e.g. excluding the furnishings and some architectural details, see Fig. 7.6). Similar to MM, accuracy cannot be guaranteed for areas around the back of buildings or within larger building complexes. These are too compositely mapped to make secure inferences on what each line conveys. Likewise, separately mapped extensions were interpretively incorporated or divided into discrete buildings with internal divisions. Outbuildings are particularly complex as a great variety was used in the Victorian city. Instead of including each feature separately, clusters of outbuildings were given a single outline. Already having the outlines of MM to refer to, in manually vectorising OS1872, features that are tantalisingly close to MM lines were traced directly, so these become consistent data through time. When the shape and direction changes in OS1872, the MM lines were deviated from.19
1550s was vectorised at the previous stage of the process. This vectorisation comprises the merged data of the adjusted plot-based and conjectural mappings of Keene (1985). Due to the historically self-selective reconstructive mapping process responsible for the creation of this data and its coarse plot level of detail, 1550s includes no unnecessary or confusing detail.20 The challenge for producing a base plan here is rather the reverse. The limitations of topographical reconstruction on the basis of the historical records (see Keene 1985; cf. Bisschops 2012) may cause unaffordable gaps preventing it from serving as an outline base plan. As mentioned, most conspicuously, buildings are not included (except for those with public and administrative functions). Importantly, as the plans are based on property records, little certainty exists on the physical empirical reality of the lines. Moreover, beyond the surface of a single property, no physical subdivisions are mapped. Keene’s (1985) abstracts of compiled historical records on each property in his gazetteer are used to detect clues about the possibility of multiple buildings, plots or gardens forming part of a single property. Oftentimes evidence for what was on a property is scant or even entirely absent (which also causes some of Keene’s own conjectures). This implies a rather crude level of conjectural mapping to add the missing built environment features as the following step, which then merge into a comprehensive outline base plan.
Keene’s (1985: Fig. 155) smaller-scale plans, indicating the built-up and probable built-up frontages along the streets, provide an additional source in aid of building conjectures onto property plots. This information is used to decide that a building needs to be conjectured. However, there is no pretention that the shape of a building reflects reality. Lewis et al.’s (1988) book Medieval Hall Houses of the Winchester Area depicts three examples of shops surveyed in the city of Winchester, which were between approx. 10 and 15m in length. These dimensions are taken as a rough maximum for typical buildings in the test area, alongside the more detailed knowledge of smaller separate properties along the High Street area. Without readily usable direct sources to ground morphological intervention, ensuring the base plan includes topological distinctions is deemed more important than the appearance of buildings and garden plots.
To illustrate the coarse effect this practice has, Fig. 7.7 shows the clear difference between the west and east sides of the northern end of current Chesil Street. The west features large subdivisions on sizeable plots, because no evidence was available beyond the suggestion that this area could have hosted a few substantial medieval buildings. The east, however, has been subdivided into smaller built environment features according to plot sizes. The one historical building still in existence (The Old Chesil Rectory) was indicated to feature two tenements with a probable communal arched entrance (Keene 1985). The neighbouring plots in that sequence feature frontages (probably built-up, according to Keene) with comparably dividable dimensions (4 or 5m each). On the opposite corner, towards the north, there is an indication that at some point during the late medieval period there could have been six shops occupying this site. In these cases, the open areas behind the buildings are not subdivided as they could well have been shared.21 Open areas are only subdivided if prompted by Keene’s (1985) discussion of the records.
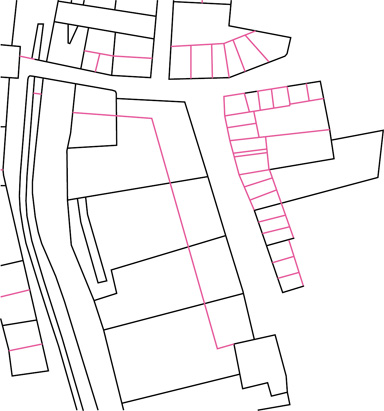
Fig. 7.7
Crude conjectural effects in the 1550s outline base plan.
The effect of crude conjectures based on scarce information on the material situation within the test case area. Dark grey depicts the lines based on Keene’s original plan, pink the building and plot conjectures added. (Image prepared on originals, reproduced courtesy of the Winchester Research Unit.)
Although these conjecturing efforts ensure the same level of detail on a conceptual level – restricted by the self-selectiveness of historical reconstructions, fragmented archaeological records or even the different nature of geographically representative city plans (e.g. MM vs. OS1872) – true equality in actual detail cannot be guaranteed. It would be a gross over-interpretation to start conjecturing absent outbuildings or architectural details. As a consequence, comparative analysis wishing to include more detailed sources should justify the simplified composition of other sources accordingly.
Chunchucmil base plan
Since the Chunchucmil plan originated as vector data, the process of creating a base plan is predominantly limited to tracing the appropriate lines with ArcGIS editing tools, as was the case for MM. Because by their very nature archaeological remains are fragmentary, straight away regular editing tools were used for conjecturing any apparent gaps in information. First, however, tracing those lines determined to be outlines revealed structural issues with the digital data and the topological integrity of composed features. The compromised data structure most probably results from the initial Adobe Illustrator drawing technique.
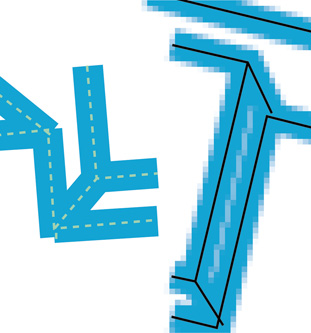
Fig. 7.8
Compromising native data quality in Illustrator and ArcGIS.
Illustrator data (left) and converted ArcGIS shape files on top of raster image (right). (Image appears courtesy of the Pakbeh Regional Economy Program with help from S. Hutson.)
Visually presentable figures revealed line constructions that were unsnapped or simply did not match the features’ geometry in minute detail (Fig. 7.8). Effective tracing requires continuous (non-intermittent) lines. Despite measuring no more than a few centimetres or millimetres in geographical space, copying these errors by tracing would compromise the topological usability of the outline base plan. Therefore the tracing process required additional editing to clean up and sometimes completely redraw features, ensuring a proper topological structure for the outlines, which are always conveyed by a single polyline. Similarly, mapped features within and across different classification layers (e.g. architecture and albarrada) can come conspicuously close to connecting – yet virtually never do these features truly connect. As a rule of thumb, detached mapped features of equal or different classifications would be connected (as snapped polylines) immediately within the outline base plan GIS layer if approximately under 50cm of width. Any larger yet analogous or conspicuously positioned gaps would be connected in a separate conjectural layer.
After having traced all originally mapped features that designate outlines, conjectures were also used more progressively. These more progressive conjectures are intended to fill in the inevitable data gaps due to fragmentary archaeological preservation. Both to respect the theoretical foundation (Chapters 3 and 4) and to enable topological spatial analyses, it is required that all the integral subdivisions composing the built environment are included as a base layer of information, avoiding any data gaps. To date, no other Classic Maya city is known to manifest such a constellation of elaborate house groupings, pathways and boundary walls in the areas outside of the monumental centre (Hutson et al. 2008; Magnoni et al. 2012), so conjecturing analogically is largely unfeasible. Therefore I decided to follow a bold but distinctive approach to conjecturing.
First, fragmented buildings would be finished continuing the shapes suggested in the observed remains. Second, fragmented boundary walls are completed exclusively with straight lines (without crossing any others), directly connecting two ends of mapped lines of the same class or onto another feature, using parallel and perpendicular alignments (see Fig. 7.9). In the highly irregular and curving urban form of Chunchucmil, straight lines will emphasise that these conjectures are not intended to represent informed reconstructions of the actual features’ shapes. Instead, they complete the spatial data by restoring a close approximation of the expected topological relations that would have existed between subdivisions. While this unavoidably affects the morphological integrity of the data, suggesting actual morphological knowledge of the features amounts to over-interpretation. Conjectured information can always be retrieved as this is kept as a separate data layer (see Fig. 7.9). Naturally, if no suggestive archaeological remains at all were mapped, no additional conjectures are invented.
These crude conjectures are a requirement of the conceptualisations behind this boundary approach (as based on outlines of discrete subdivisions, Chapters 4 and 5). It is not suggested here as general archaeological practice, and is not a necessity for each form of analysis and interpretation on the basis of the plan (as demonstrated in Magnoni et al. 2012; Hutson & Welch 2016).
To ensure critical evaluation, the complementary conjectures went through three iterations. The initial phase concerned the coarse connecting up of features on screen. Then these were revised based on the principle that directly or indirectly all spaces within an urban environment must be accessible to partake in the socio-spatial inhabitation of the city. This comes down to: how is one able to traverse the site respecting the actual physical barriers mapped? As a shorthand to revealing possible accessibility patterns, open surfaces and alleyways affording movement, flow, and access to building complexes were drawn on a semi-transparent sheet over a high-resolution printout of the test case area. The conjectures were then adjusted accordingly to better facilitate or enable traversing where necessary. The final revision is a side-effect of the actual process of BLT identification (see below). This process highlights any subdivision where a specific discrete outline was intuitively expected, but absent.22 The particular relationship between virtual boundaries (Chapter 5) and conjectures is discussed later in this chapter.
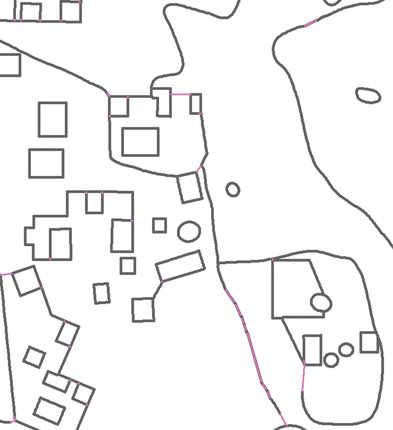
Fig. 7.9
Extract of Chunchucmil’s base plan with conjectures.
This extract consists of traced outline features (in grey) and minor and coarse conjectures (pink). (Image prepared upon original data, courtesy of the Pakbeh Regional Economy Program with help from S. Hutson.)
In keeping with outline logic, furnishings and internal arrangements as indicated by archaeological artefacts, stelae and quarries are excluded in the base plan. A quarry could only be (partially) included when its shape suggests incorporation as part of a built boundary. Querns or metates (grinding stones) within gaps breaking up the course of walls are taken as an indication of a probable passage way, because the arduous task of grinding in all probability had a social element to it (Hutson pers. comm. 2012). Bedrock, however, is included as these outcrops of the natural substratum would have impeded thoroughfare and are often incorporated in boundary walls and even minor architecture.
It is a common expectation that various structures within groups of buildings could have been perishable (Becker 2001; Magnoni et al. 2012; Hutson 2016). The chich mounds (low piles of rubble) mapped on the original Chunchucmil plan have been suggested as having formed the foundations of (perishable) buildings (Magnoni et al. 2012). Indeed, regular placement in association with building groups of (circular) chich mounds conspicuously resembles the round architecture mapped onsite. Ancient Maya buildings do not typically straddle albarradas (Magnoni et al. 2012) and therefore, in revised iterations of the base plan, chich mounds with dimensions similar to round architecture and placed detached from albarradas are included in the base plan assuming they carried a structure. Chich mound outlines are excluded in the rare instances where they are located along (albarrada) margins or their shape seemed illogically irregular for an occupiable structure, though a partial edge may coincide with another outline.
Magnoni et al. (2012) offer a population estimate which is partly based on the count of residential structures (the method of Rice & Culbert 1990). The boundary approach is based on only material-spatial information and cannot consider functional links between structures partaking in a building group. Becker (2001) gives a good overview of possible structures’ functions, but also how few of them are systematically identifiable.
There are also ambiguities such as the ‘screen walls’ connecting structures in building groups in various Classic sites, mentioned by Becker (2001; Tourtellot III 1988). These could easily be confused with remnants of communal platforms and do not often form a discrete subdivision. In such cases, the mapmakers’ expertise is a cautious guide for where they indicate a group (or platform) on the plan (with block annotations). In addition, various fragments of albarradas can also be found ‘dangling’ inside house-group-lots. Rather than creating actual subdivisions, these dangling lines may form part of internal arrangements in concordance with the activity areas and perishable boundaries mentioned above.
To enable a critically reflexive research practice, all ambiguous features are initially traced as part of the base plan (see Fig. 7.10). Where a feature is clearly truncated by another feature, in the sense of being subject to later modification of any type or having become obsolete, only the feature that appears responsible for the truncation (supersedes) is taken into account. There is too little knowledge about these architectural palimpsests on the basis of the survey alone to know the correct order or composition.
The stage of identifying BLTs is an interpretive process on top of the base plan. The BLT identification process may indicate where or how conjectures would be expected in order to complete a discrete subdivision. With this in mind, all dangles or incomplete subdividing features that remain after BLT identifications can be removed from what then would become the actual ‘final base plan’. The researcher should always be mindful of the possibility that, consciously or subconsciously, readily perceived or concealed, subjective patterns could emerge from the anterior decisions and rules of thumb regarding outlines and conjecturing. The ‘final base plan’ could be said to be an exact copy of all BLT identifications taken together at once.
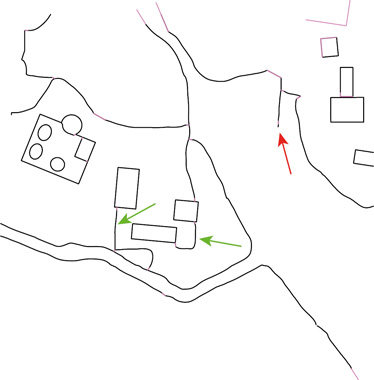
Fig. 7.10
Another example of the Chunchucmil base plan with conjectures (in pink).
The green arrows indicate incomplete subdivisions (possible screen walls), while the red arrow indicates what currently looks like a real dangle. How both situations are treated will need to be settled during BLT identification. (Image prepared from original data, courtesy of the Pakbeh Regional Economy Program with help from S. Hutson.)